The internet is changing, and fast. For years, the holy grail of digital marketing has been ranking high in Google’s traditional “10 blue links” search results. But with the rapid rise of AI, that landscape is shifting dramatically. Google’s new AI Overviews (and similar features from other platforms) are designed to provide direct answers, summarize…

The Hall Blog

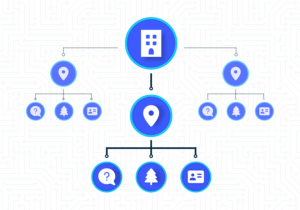
A Beginner’s Guide to Getting Your Business Noticed by AI Search
For years, the goal was simple: get your business to the top of the search results page. But with the rise of AI, the search landscape is changing. People aren’t just clicking links; they’re asking questions and getting direct answers from powerful AI models. So, how do you make sure your business still gets seen?…
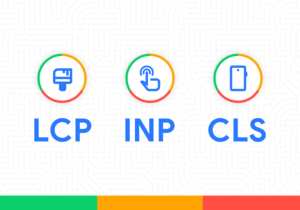
Evolving from Keywords: Prioritizing Core Web Vitals
In the world of SEO, user experience is no longer a fringe factor; it’s a central component of Google’s ranking algorithm. At the heart of this shift are Core Web Vitals, a set of specific metrics that measure a website’s real-world user experience. A strong score can give you a competitive advantage, while a poor…
Beyond Code: How AI Tools like Cursor are Revolutionizing SEO
Okay, so here’s something that blew my mind recently. You know those AI coding tools like Cursor and Windsurf that all the developers are raving about? Well, turns out they’re not just for writing code. I’ve been experimenting with them for SEO work, and honestly, it’s been a game-changer. Let me walk you through what…