 Modern web browsers do a pretty decent job translating the HTML, CSS, and JavaScript that comprise the web into the graphic pages we know and love. Something a lot of people don’t know is that our browsers also come with the ability to take a look under the hood, so to speak.
If you’ve read the title of this blog post, you already know I’m referring to developer tools. Let me first state that the name is misleading. While, yes, developer tools are incredibly useful for web developers, they’re fairly accessible and offer even the most novice site admin the chance to take small tasks into their own hands.
Open DevTools:
The first thing you’ll want to do is open up your toolbox and take a look around. In any of the major browsers* simply right click on a page element and look for the Inspect or Inspect Element option. Developer tools will slide up from the bottom of the screen, out from the side or pop up in a new window.
Here’s what our homepage looks like when I right click and inspect an image in Chrome:

If this looks intimidating, don’t run away just yet. Here are three simple tasks that any site admin should be able to do using DevTools.
* Safari requires users to go into preferences and activate Develop Menu
Check Image Sizes:
Ever find yourself wondering what size an image needs to be in order to match it with another image somewhere on your site? DevTools makes finding the size of an existing element easy. Right click on the item in question (I chose the 2013 best places to work logo above), select Inspect Element and then hover over its URL in the in the developer tools tray.
On the page you can see that the image is highlighted blue and it displays at 161 by 44 (this is in pixels). In the tray itself you can see a sample of the image as well as its dimensions again.
Pro-Tip: Try clicking the arrow button at the top left of the DevTools Tray and now move your mouse over different elements on the screen. ![]()
See What Font is Being Used:
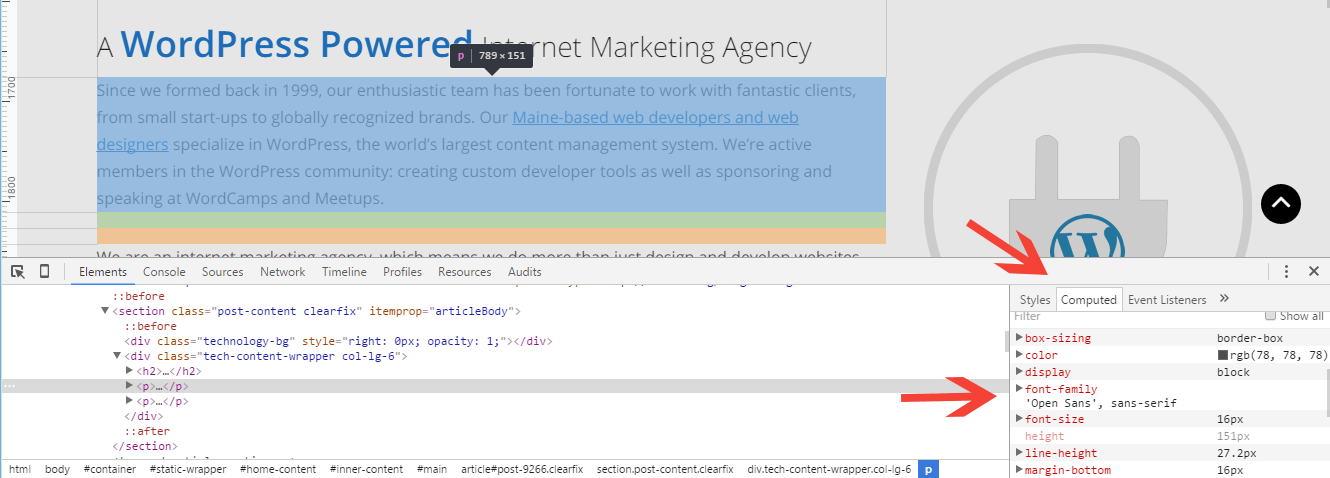
If you’ve ever had to try and identify a font by eye, you’ll know how much of a time saver this tool is. To view the font for a section of text simply right click on it, select Inspect, and on the far right click on the Computed tab.
You may have to scroll down just a little bit until you see characteristics like font-family*, font-size, and color.

* Font-family is a prioritized list of fonts telling the browser to use the first if it is available otherwise use the next.
See How Your Site Looks Like On Varying Screen Sizes:
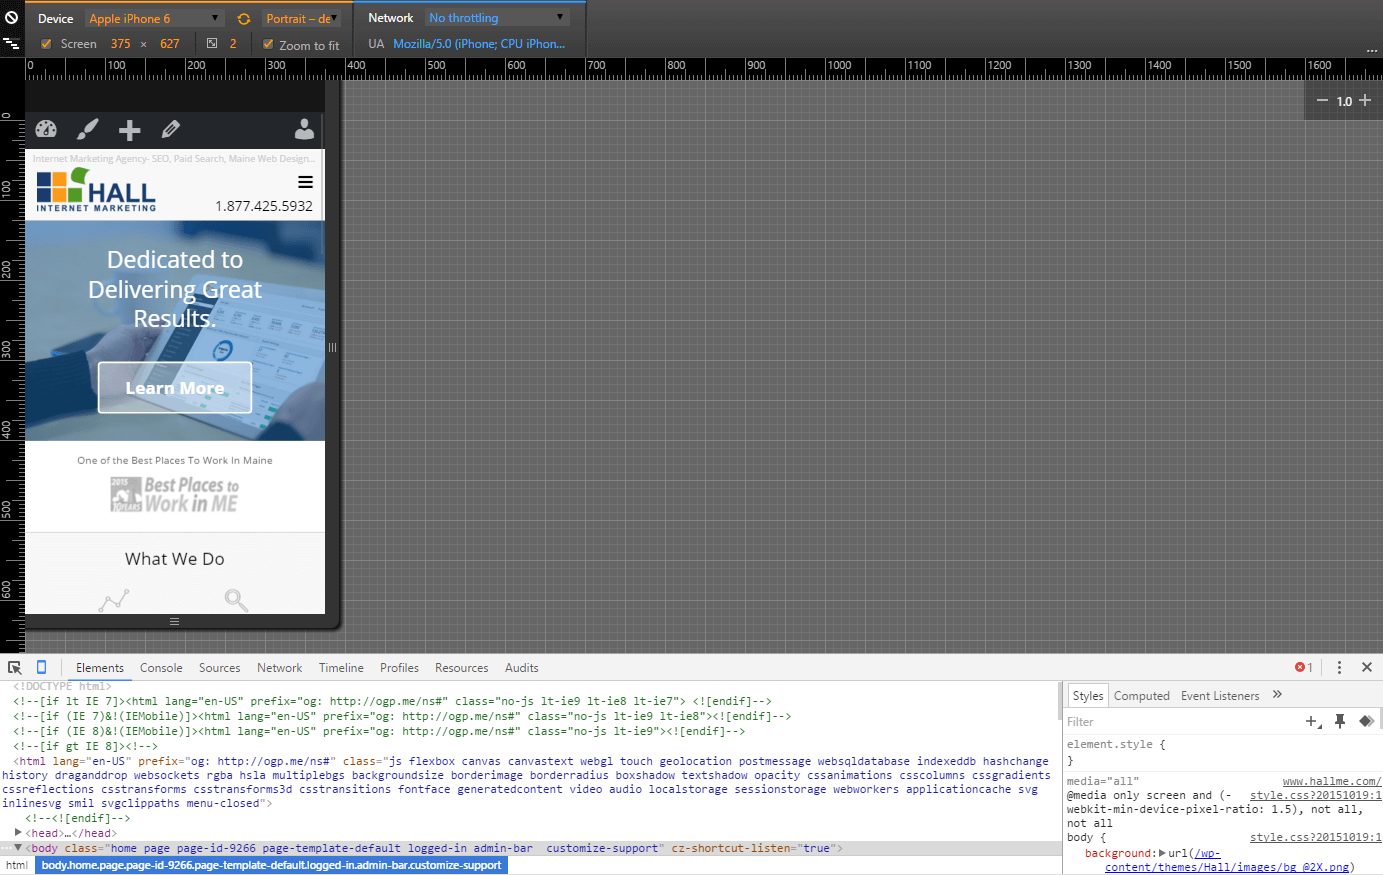
This is one of my favorite features in developer tools. By clicking the small phone icon in the top right of Chrome’s DevTools or the Responsive Design Mode button in Firefox, you can test how your site displays on different screen sizes and devices.
Once this has been activated you can drag the edges of the display to varying shapes or use the preset devices such as Apple’s phones and tablets or Google’s Nexus lineup.

There are tons of other things that you can do using developer tools. I won’t cover all those features in this post, but if you’re curious here are some links to learn more:


