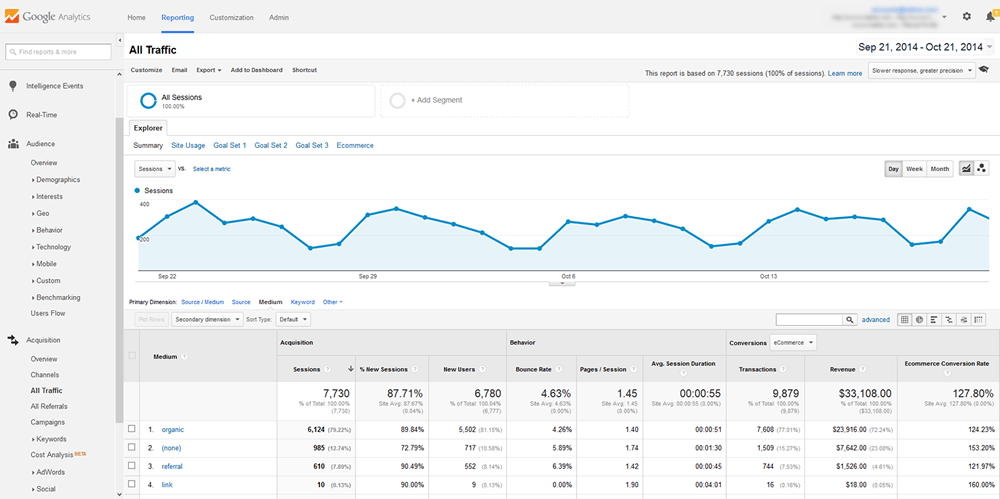
Website redesigns are expensive and time intensive. Chances are you’ll need to prioritize elements in order to keep your redesign on time and under budget. In order to make these decisions, and evaluate redesign performance, you’ll need an understanding of which web metrics to track (and which to ignore).
In this post, we’ll walk through how to use existing website data to inform your site redesign goals and objectives using Google Analytics data. After reading this overview, you should be able to create an easy-to-digest report that shows you how important web performance benchmarks have been impacted by the redesign of your website.
Using Metrics That Matter
Using three metrics from Google Analytics, we can benchmark the current performance of a website.
1. Bounce rate is the percentage of single-page sessions (i.e. sessions in which the visitor left your site from the entrance page without interacting with the page). There are a number of factors that contribute to a site’s bounce rate. For example, users might leave your site if there are usability or web design issues. Alternatively, users might also leave the site after viewing a single page if they’ve found the information they need on that one page. For example, it is not uncommon for contact us or customer service pages to have higher bounce rates than other types of pages on a site. For best results, you may want to look at the bounce rate of sections or page types, rather than as a single metric for your site.
2. Pages/Session (Average Page Depth) metric displays the average number of pages viewed per session. Repeated views of a single page are counted in this calculation. This metric can be helpful as an aggregate total as well as when it is viewed with other dimensions, such as by device type.
3. Goal conversion rate is the rate at which visitors are performing goals that you specify. Goals can include transactions, phone calls, form submissions, or other interactions that you designate in Google Analytics. Your goal conversion rate likely varies by device type (desktop, tablet, phone), especially if your site has not been optimized for mobile.
Generating a Benchmark Report with Google Analytics
To pull a benchmark report (like the one shown above), which shows bounce rate, pages/session, and conversion rate averages, we can use the All Traffic Report from Google Analytics. To create this report:
1. Sign into your Google Analytics account and drill down into the property you wish to work on.
2. Click on the Acquisitions tab in the main navigation on the left of the screen.
3. Click on the All Traffic button in the Acquisitions tab sub-menu.

Making Sense of the Data
Reviewing your site’s current data can help inform your goals for the redesign of your site.
A poor bounce rate indicates that visitors are not engaged by your site’s content and design. Bounce rates vary by industry and site type (https://blog.kissmetrics.com/bounce-rate/). If your site’s bounce rate is well above average, you should take steps to either incrementally improve the most critical sections of your site, or redesign it entirely.
A low pages/session and average session duration, indicates the quality of your traffic and the way visitors behave when entering your site. If your goal is to encourage visitors to explore your site and products more in depth, you should consider adding additional rich content to your site. Options include blog posts, publishing industry guides, and featuring product videos on your site.
Goal conversion rates vary widely by medium (organic, paid search, etc) and industry. The primary goal of most marketing professionals and website owners is to strive to improve this metric in hopes of converting visitors into paying customers at a higher rate. Setting an incremental improvement goal for the overall website, as well as by medium, can help you evaluate if the changes to your website have been successful.
Comparing Your Traffic After Your Redesign
After your site is redesigned, you can compare the benchmark data points you took before executing the redesign (bounce rate, pages/session, and conversion rate) to see what kind of increase in performance you’ve achieved with your new site.
To generate a new report, you can follow the same steps outlined above. You can use the comparison date range selection on the left hand side of Google Analytics to evaluate performance between two time periods.
Keep in mind that the bigger the data sample, the more reliable your data will be. Comparing only on day worth of data after the redesign to one day prior to the redesign is not as actionable as comparing two longer periods of time. If your business is influenced by seasonality (For example, if you have an e-commerce business that has a much higher conversion rate around Christmas than during other times of the year), you should factor this into your analysis.
Using Your Knowledge
Regardless of your business size or type, continually optimizing your website is important in order to stay relevant on the web. Increasing the performance of your website can translate into higher profits, both on and off the web.
Hopefully after reading this post, you can confidently set goals for a website redesign and track the impact it has on your traffic quality and marketing performance.


