Scenario: You and a co-worker are tasked with providing a high-level analysis on Google Analytics data for the previous year. You both pull the same report, but find that you end up with different totals at the end. You double and triple check your work, but keep getting different results each time. After racking your brains around for a while, you realize that Google has sampled your data set.
What is sampled data in Google Analytics?
Sometimes when querying a very large data set, the Google Analytics interface will sample your data. What this means is that Google only takes a portion of the data set which it can handle, and then calculates and estimates the totals based on that sample set.
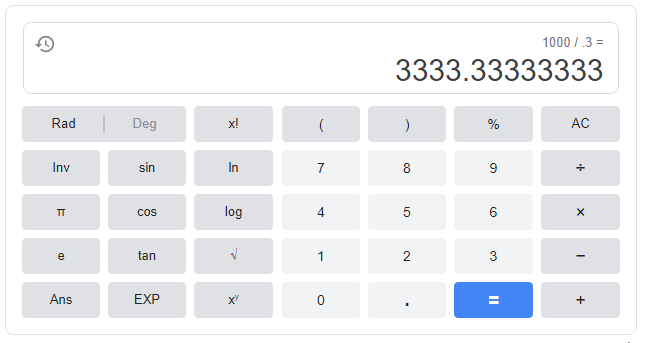
For instance, if Google Analytics takes a sample set of 30% of your data, it will use that 30% of the data to estimate what a full 100% would look like based on the data available. To do this, GA takes a metric value from the sample data set and divides that number by the percentage of data it is using for its sample set.
In this example, if there were 1,000 sessions during the time in question, Google would divide that number by 30%, estimating the full amount as:

It would show the total amount of sessions as 3,333 in the interface, even though the actual number of sessions may be much different from this estimated value.
How can I tell if my Google Analytics data is being sampled?
Google Analytics tends to sample your data when you have a wide date range and are pulling a lot of data points. Adding segments to your data set tends to trigger sampling more often than when looking at All Users.
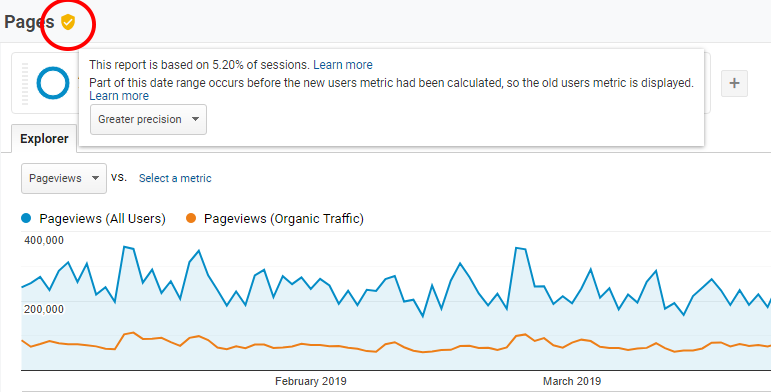
You can tell if a report is being sampled by hovering over the shield checkmark icon next to the report name, right below where you can change which account you are using.

How can I see my Google Analytics data unsampled?
Unfortunately, there is not an easy way to see unsampled data in the Google Analytics Interface itself. But luckily for us, Google has provided an even better viewing option: a standalone tool that will allow us to see the data in its entirety.
Google Data Studio pulls data from the Google Analytics API directly without any restrictions in the sample size. There are limits to the API, but most users will not have to worry about hitting these thresholds.
Analysts can set up Google Analytics data connectors for each of their accounts and use these connections to create the data reports that they need. Google Data Studio has a wide range of options to report data including tables, time series charts, bar graphs, pie charts, area charts, geolocation maps, and more.
As you use Data Studio and see the value in its powerful features, you will find yourself on the native Google Analytics interface less and less. You can kiss your sampled data problems goodbye!


