After many years of being neck-deep in Google Analytics, I finally had the chance to complete the Google Analytics IQ test. While reviewing for the test, I rediscovered features that I do not use nearly enough when looking at site data. Perhaps if I am skimping on them, some of you are too – so let’s take a look!
- On Site Search and Search Refinement Report
By reviewing search terms that people searched for within your site, you can not only see keywords not previously identified for AdWords campaigns, but content that visitors are trying to find that is not easily navigated to. Search refinement, on the other hand, occurs after the original internal site search is performed. By seeing how visitors refined their searches is an opportunity to modify the initial result page for the first internal search. - Search Navigation Report
Adding onto #1, you can also see where the visitor started the search, and follow the path where visitors who search on a specific keyword go after viewing the search result page. You can see if that site search leads to a conversion or sale. By looking at Start pages, you can assess the effectiveness of that landing page, and learn about the keywords searched on from that page. This can provide details on how you can make the landing page more useful so the visitor doesn’t need to work as hard to get to what they are looking for.Site Search reports are located in the Content area of Google Analytics and need to be activated in the Profile Settings. For more details watch the Google module on this topic. - Search and Replace Filters
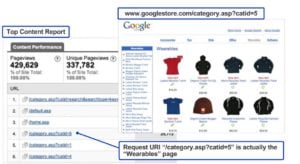
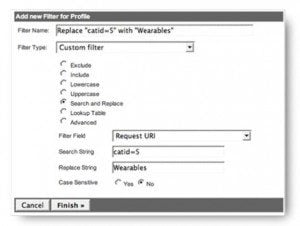
You can create a Custom Filter that can replace a Request URI with a more meaningful description. For example, in the Top Content Report, you may have a list of URI’s that are not descriptive, and make it hard to analyze, such as /category.asp?catid=5, /category.asp?catid=41, /category.asp?catid=32 and so on. By using the Search and Replace Filter, you can provide content names to specific query stings, making the report a lot easier to digest.You can read more about search and replace filters on the Analytics module on Filters. - Reverse Goal Path Report
Sometimes the path people take on their way to completing a goal you have set up is much different than the path you intended for them to take. Knowing that information can really help you with your site elements and goal conversion strategy. Found in the Goals section, you can see goal data defined without a sales funnel. It lists the navigation path that users took to arrive at a goal page, and provides the number of conversions that resulted from each path. This report demonstrates internal linking opportunities that you haven’t considered before, and offers ideas on how you can most efficiently provide visitors with information that they are looking for.If you want to know more about goals and funnels, check out the learning module on those topics. - $ Index
Found in the Content area, the $ Index metric is the sum total of (Revenue + Goal Value) / Unique Views of Page Before the Conversion. It allows you to see the value of pages that have the most potential for site profitability. It’s most useful as a ranking metric and and shouldn’t be used as a standalone number. In order to use the $ Index metric, you need to have assigned goal values or have e-commerce revenue, otherwise the $ Index metric will be zero.You can read more about the $ Index on this learning module. - Graph Dayparts Against Transactions
If you manually tag your ads, you can only see campaign and keyword data, and won’t receive many of the dimensions that can offer actionable insight. We already implement AdWords autotagging as a common practice, one feature to take advantage of is to graph dayparts against Transactions. Click on Traffic Sources > AdWords > Dayparts. Click on the top Visits tab, and choose Compare Two Metrics. I chose to compare Vists and Transactions below. Then drill down to Keyword – you can drill down even further by keyword and hour of day, and adjust AdWords bids accordingly. To see the full review, watch this video.
All of the study guides are located here. Because many are in presentation format, they are easy to digest. Definitely recommended if you are regularly in your site’s analytics.


