Site performance is the future.
In the early days, building a website was all about seeing what the web could do. Catching the user’s eye was more important than being fast. Trying a cool new menu design sometimes took priority over actually navigating the menu. Everyone was learning and building and sharing what worked and what didn’t. As a result, decades later we have a pretty good idea of what should be standard on most sites. So when most sites generally look and function the same, how does your site stand out? By being faster and prioritizing the user experience.
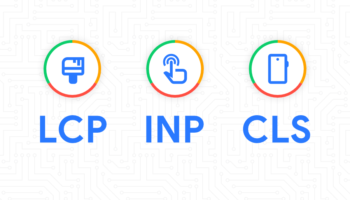
Google is currently paving the way for this future with its new Core Web Vitals — a set of performance measurements focused on improving the user experience. The Web Vitals include three measurements: Largest Contentful Paint (LCP), First Input Delay (FID), and Cumulative Layout Shift (CLS).
- Largest Contentful Paint (LCP) provides a rough measurement for when the page’s main content has loaded.
- First Input Delay (FID) estimates how long it takes before a user can interact with the page.
- Cumulative Layout Shift (CLS) checks for unexpected layout shifts as the page loads.
So how do we measure these metrics? One of the most popular services is Lighthouse, an automated tool for analyzing site performance. Let’s go through how to use Lighthouse with the Chrome extension.
After downloading the extension, open the Google Chrome browser and go to a page you want to measure. Open DevTools and select the Lighthouse tab. Then for categories, select Performance and select a device. Click Generate Report.
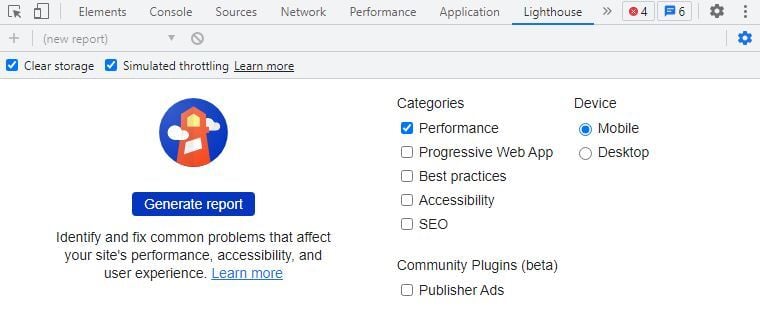
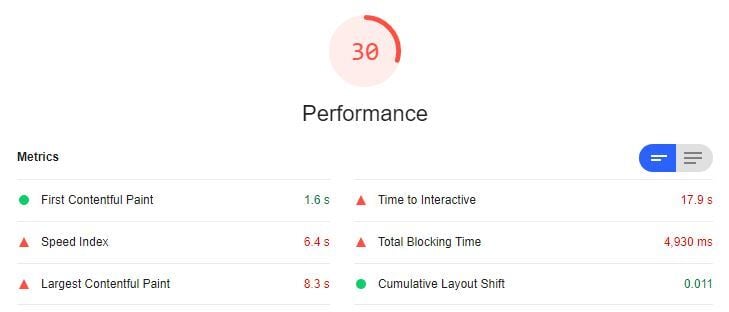
The report begins with a basic summary of scores for the core metrics.
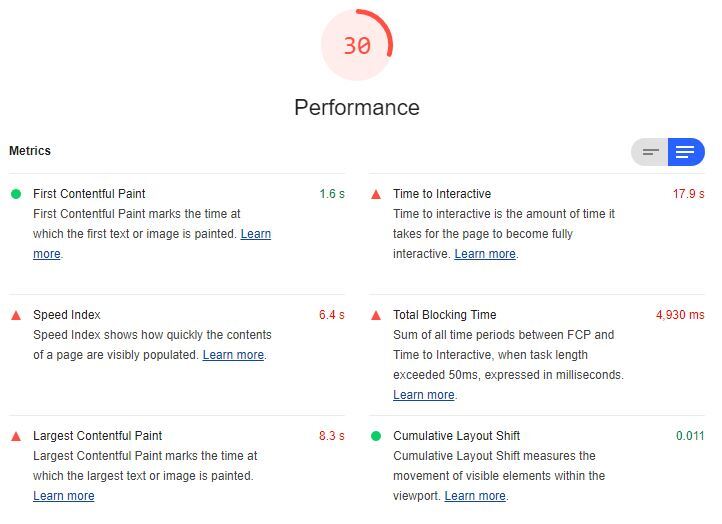
Selecting the right menu toggles further details. Visit the Learn more links to get more information about common ways to improve each of these metrics.
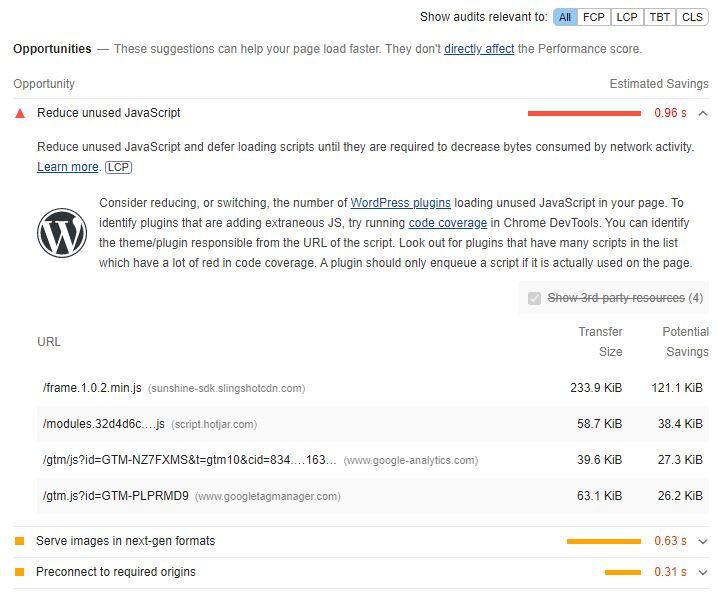
The Opportunities section shows specific actions you can take to speed up your site.
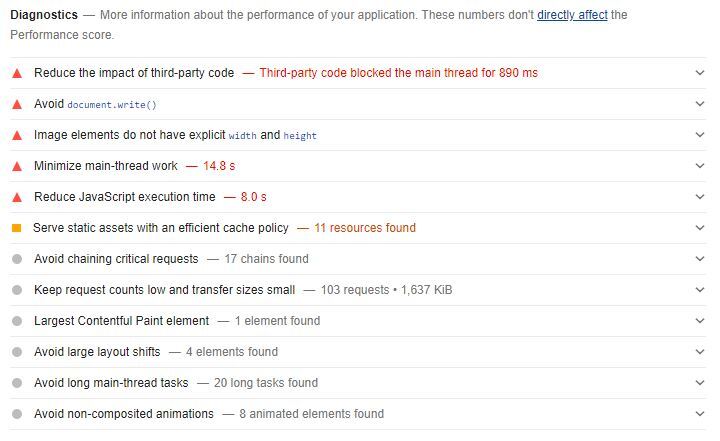
The Diagnostics section outlines a more general list of ways to improve site performance.
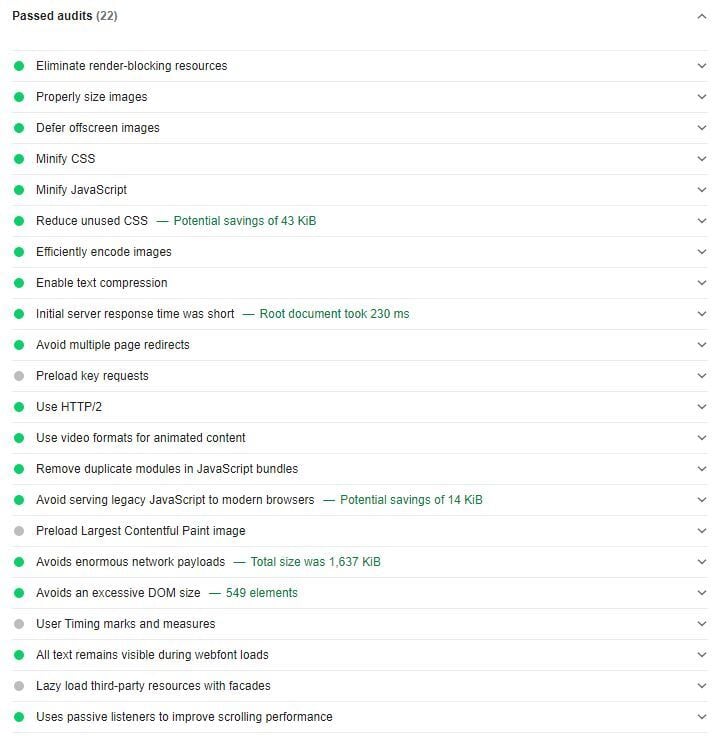
And to close out, the Passed Audits highlight the areas where you’re delivering a great user experience.
Running a Lighthouse audit is just one tool for improving your site’s performance. It’s especially useful while in the process of fixing Web Vitals issues because it runs in the browser and only on the specific page you’re visiting, so the process of trial and checking for error via Lighthouse scan happens fast. Improving a site’s performance often involves repeatedly making small changes that you think might help, running a Lighthouse scan, and reevaluating based on the results.
But how do we know where the issues are? There are additional tools for scanning your entire site — such as Google’s Search Console. Search Console will scan every page on your site for Web Vitals issues and output a report with the specific URLs affected. That report can then be used with Lighthouse to diagnose the specific problems on those pages. Some other options for single-page testing if you don’t want to download a browser extension are web.dev’s measure tool and PageSpeed Insights. Just enter the URL of the page you want to test and run a scan.
However you choose to go about diagnosing and fixing your site’s Core Web Vitals issues, know that by doing so you are putting the experience of your users first. Google has been providing performance measuring tools for years, but the Core Web Vitals metrics are tailored specifically towards improving the user experience and aim to give developers an understanding of how users experience their site. Run a scan today to see how your site measures up — and if you’re ready to improve your Core Web Vitals and boost your site’s performance, contact the experts at Hall.

