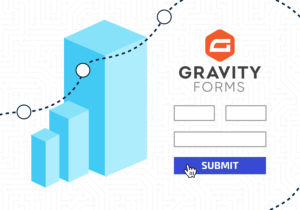
Understanding where your leads come from is crucial for making smarter marketing decisions. If you’re using Gravity Forms to collect leads on your WordPress site, you have several options to track attribution, including UTM parameters, referral sources, and more. In this post, we’ll explore three methods to track attribution in Gravity Forms — from a…

The Hall Blog

Why User Consent is Key to Modern Web Development
A Technical Look at Cookie Compliance In modern web development, data collection drives critical functions like analytics, personalization, and ad targeting. But any handling of personal data—especially via cookies—must comply with strict privacy laws. Regulations such as the GDPR and CCPA mandate explicit user consent before loading non-essential cookies or tracking scripts. For developers, this…
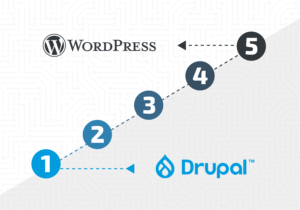
How to Migrate a Drupal Site to WordPress: A Step-by-Step Guide
Migrating from Drupal to WordPress is a common choice for website owners looking for a more user-friendly and flexible platform. While Drupal is a powerful content management system, it often requires advanced technical knowledge to maintain and customize. WordPress, on the other hand, offers a more intuitive interface, a vast selection of themes and plugins,…
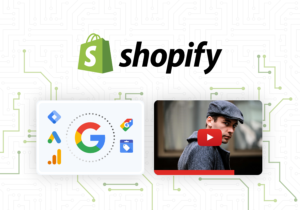
Seamlessly Integrate Google Services with Your Shopify Store
Enhancing your Shopify store with Google Services is crucial for understanding your audience, driving traffic, and boosting sales. This blog post will guide you through the process of integrating Google Analytics GA4, Google Ads, and Google Merchant Center using the Google & YouTube app from Shopify, as well as setting up Google Tag Manager for…